Table of Contents
hide
Introduction
- The flow process chart was originally introduced by Frank Gilbreth in 1921 as a structured method for documenting process flow.
- The flowcharts are pictorial representation of the methods to be used to solve a given problem and help a great deal to analyze the problem and plan its solution in a systematic and orderly manner.
- A flowchart when translated into a proper computer language, results in a complete program.
Definition
- A flow chart is a step-by-step diagrammatic representation of the logic paths to solve a given problem.
- A flowchart is graphical/visual/pictorial representation of an algorithm.
Features
- It represents a workflow or process of a system.
Advantages
- It shows the logic of a problem displayed in pictorial fashion/form which is easy to identify/understand.
- It is useful for debugging and testing the programs.
- Program could be coded efficiently & easily using flowcharts.
- The Flowchart is good means of communication to other users.
- The flowchart allows the problem solver to break the problems into simpler parts. These parts can be connected to make master chart.
Disadvantages
- It is not useful to represent/solve complex program logic.
- For any alterations during creation of it, the flowcharts have to be
redrawn completely/with difficulty.
Rules/Conventions for Drawing Flowcharts
- It should be drawn from top to bottom.
- A flowchart always begins with start symbol and ends with stop symbol.
- Flow lines are used to join the symbols.
- Arrows should not cross each other.
- Decision box should have one entry point and two exit points.
- For lengthy flowcharts in more than one page, connectors are used to join them for continuity.
Flowchart Symbols
There are following symbols used while drawing flowcharts as per conventions followed by International Standard Organization (ISO).
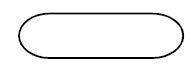
(A) Start or Stop (terminal) Symbol –
- Oval/Rectangle with rounded sides/shape is used to indicate either START/ STOP of the program.
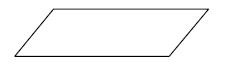
(B) Input or Output Symbol –
- Parallelogram symbol is used to read/Input or Print/Display data or information.
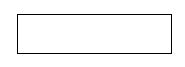
(C) Processing Symbol –
- Rectangle symbol is used to represent calculations, processing or data manipulation.
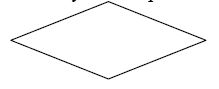
(D) Decision Symbol –
- Diamond shape is used to represents comparisons or decisions making and branching. This diamond box is called decision box.
- Decision boxes are used to test the conditions or ask questions and depending upon the answers, the appropriate actions are taken by the computer.
(E) Looping Symbol –
- Horizontal Benzene shape represents a group of instructions to be
executed repeatedly.
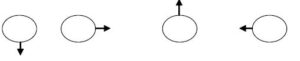
(F) On- Page Connectors Symbol –
- Circles are used to join the different parts of a flowchart and these circles are called on-page connectors.
- The uses of these connectors give a neat shape to the flowcharts.
- In a complicated problems, a flowchart may run in to several pages. The parts of the flowchart on different pages are to be joined with each other. The parts to be joined are indicated by the circle.
- Small circle symbol indicates an entry or an exit to another flowchart part/area on the different pages.
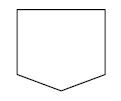
(F) Off- Page Connectors Symbol –
- This connector represents a break in the path of flowchart which is too large to fit on a single page.
- It is similar to on-page connector.
- The connector symbol marks where the algorithm ends on the first
page and where it continues on the second.
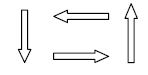
(G) Direction Flow Lines Symbol –
- Arrow symbol (up, down, left, right) indicates the direction of processing or flow of control.
- In a Flowchart, every line must have an arrow on it to indicate the
direction. - The arrows may be in any direction as per problem’s solution.
![]()
0 Comments