History
- Peter Chen developed the E-R Diagram in the 1970s and published his proposal for entity relationship modeling in a 1976 paper titled “The Entity-Relationship Model: Toward a Unified View of Data”.
- Peter Chen was a computer scientist who worked on improving database design.
Introduction
- E-R diagram stands for Entity-Relationship (E-R) diagram.
- E-R diagrams are fundamental in the initial stages of database design and management, ensuring a visual method to represent the database structure aligns with real-world data interactions and requirements.
Definition
-
Entity-relationship model is database analysis and design tool. It lists real-life application entities and defines the relationship between real-life entities that are to be mapped to the database.
- An Entity-Relationship (E-R) diagram is a crucial tool used in database design to visually map out the structure and the interconnections of the data within a database.
- An ER diagram, or entity-relationship diagram, is a visual representation of the relationships between entities or objects in a database.
- An ER (Entity-Relationship) diagram is a graphical representation of entities and their relationships to each other in a database.
Characteristics
- An Entity-Relationship (E-R) diagram visually represents the data within a system and the relationships between those data points.
- The E-R diagram helps in developing a conceptual design for the database. Thus, the E-R model forms the basis for database design. It is a high-level logical data model.
- ER diagram can also be used to help identify any potential issues or inconsistencies in the data model.
- An ER diagram provides a visual representation of a database schema, making it easier to understand and modify.
- ER diagrams are used to visualize and design the structure of a database, ensuring that it meets the requirements of the intended application.
- It is used to model the data in a database and is a critical part of database design. In other words, it is used to model the data requirements of a system or application and to design the database structure that will be used to store and manage the data.
- An ER diagram provides a high-level view of the data requirements of a system or application, allowing designers and developers to better understand the relationships between data elements and design an efficient and effective database structure.
- There are three main components in an ER diagram:
- Entities – the objects or concepts that have properties.
- Attributes – the properties or characteristics of the entities.
- Relationships – the associations or connections between the entities.
The notation used in E-R Diagram
- An ER diagram is usually designed using the following notation/convention:-
- The entity is represented by a rectangle symbol with the name of the entity inside it.
- The attribute is represented by an oval shape with the name of the attribute inside it, connected to the entity by a line.
- The primary key value is underlined within an entity.
- A relationship is represented by a diamond shape connected with the entities involved in the relationship, with the type of relationship written on the connecting lines. Relationships describe how entities are related to each other, such as one-to-one, one-to-many, and many-to-many. The connecting lines may have symbols at the ends to indicate the type of relationship. Relationships between entities are represented as lines connecting the boxes, with cardinality indicators (such as 1 or *) to indicate the number of entities involved in the relationship.
Terminology
- Entity:
- An Entity may be any object, thing, place, person, name, class, etc that is used as a component of a system and can exist independently, and is distinguishable from other objects.
- An entity is a real-world object or concept that has data associated with it, such as a person, place, or thing. Entities are objects or concepts that have properties, and relationships are the associations between entities.
- An Entity can be identified uniquely.
- An entity represents a real-world object or concept, which can be distinctly identified.
- For example, in a university database, entities might include Student, Professor, and Course.
- A rectangle symbol usually represents entities.
- Entity Set :
- An entity set is a collection or set of all entities of a particular entity type at any point in time.
- An entity set is a collection of similar entities.
- All entities in an entity set have the same attributes. for example – the entity set “Customer” might include entities like Customer1, Customer2, etc., all of which share attributes like CustomerID, Name, Email, and PhoneNumber.
- Entity sets are crucial for structuring and organizing data in a database.
- They ensure that entities are grouped logically, which aids in efficient data management and retrieval.
- Understanding entity sets and their attributes is fundamental to effective database design and implementation.
- The type of all the entities/entity sets should be the same.
- For example, The entity set Student of University, the entity set Student of School, The entity set Employee of Factory, The entity set Employee of Hospital, etc.
- In an E-R diagram, entity sets are depicted as rectangles. The attributes are typically shown as ovals connected to their respective entity. The primary key is often underlined to distinguish it from other attributes.
- Entity sets help in organizing the data by grouping similar entities together.
- They are essential in the design phase of databases, ensuring that data is structured logically and efficiently.
- Well-defined entity sets can improve the efficiency of queries (Query Optimization) by enabling clear and precise data retrieval.
- All rows of a relation (table) in RDBMS are entity sets.
- Entity Type :
- It refers to the category that a particular entity belongs to.
- For example – An entity Employee may be Govt. Employee or Non-Govt. employee, Product may be Local or Global, Leader may be National or International, etc.
- The name of a relation (table) in RDBMS is an entity type.
- Types of Entity:-
- Strong Entity:
- A strong entity (also known as an independent entity) is a type of entity in an E-R diagram that can be uniquely identified by its own attributes without relying on any other entity.
- Strong entities have a primary key that uniquely distinguishes each instance within the entity set and can exist independently.
- strong entities are depicted as rectangles, and their attributes, including the primary key, are shown as ovals connected to the rectangle.
- For example- Chapter is the weak entity of the Book(Strong) entity.
- Weak Entity:
- An entity that depends on another entity is called a weak entity.
- The weak entity doesn’t contain any key attribute of its own.
- The weak entity is represented by a double rectangle symbol.
- For example – Installment is a weak entity that depends on the Loan (strong) entity.
- Tangible/Concrete Entity :
- Entities that exist in the real world physically are called Tangible Entity.
- Examples are:- Person, car, etc.
- Intangible/Abstract Entity :
- Entities that exist only logically and have no physical existence are called Intangible Entity.
- Examples are:- Digital Bank Account, etc.
- Strong Entity:
- Attributes:
- Attributes are used to describe the properties or details of an entity.
- An entity is represented by a set of attributes.
- Attributes are the characteristics/properties of an entity, such as its name, age, or address.
- For instance, a Student entity might have attributes such as student ID, Name, Email, and course.
- Attributes are typically represented by oval/ellipse shapes or symbols connected to their respective entity rectangles.
- Types of attributes include:-
- Key Attributes: The key attribute is used to represent the main attribute of an entity. This attribute is used as a primary key. The key attribute is represented by an ellipse with the text underlined.
- Simple vs. Composite: Simple attributes are indivisible, while composite attributes can be divided into smaller sub-parts. A composite attribute is composed of more than one attribute. The composite attribute is represented by an ellipse and is connected with sub-parts of attributes with an ellipse. For example – The name attribute is a composite attribute because it may consist of first_name, middle_name, and last_name.
- Single-valued vs. Multi-valued: Single-valued attributes hold a single value, whereas multi-valued attributes can hold multiple values. The double oval is used to represent multivalued attributes. For example- a student can have more than one phone number.
- Derived: Attributes whose values are derived from other attributes. It can be represented by a dashed ellipse symbol. For example – A person’s age changes over time and can be derived from an attribute like Date of birth.
- Relationships:
- A relationship is defined as an association among several entities.
- Relationships define the connections between entities, such as a person’s relationship to a company they work for, or a product’s relationship to a supplier.
- For example, a Student entity might be related to a Course entity through an Enrollment relationship.
- Relationships are depicted by diamond shapes or lines connecting entities.
- Relationship Sets:
- A relationship set is a set of relationships of the same type.

-
-
- Degree of Relationship Sets:
- The number of entity sets that participate in a relationship set is termed as the degree of that relationship set.
- Degree of a relationship set = Number of entity sets participating in a relationship set.
- Types of Relationship Sets:
- Based on the degree of a relationship set, a relationship set can be classified into the following types-
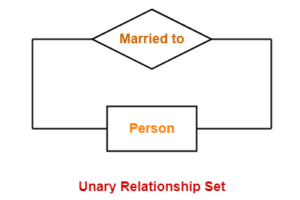
- Unary/Recursive Relationship Set:
- An unary relationship set is a relationship set where only one entity set participates in a relationship set.
- It is also called Relationships of Degree 1.
- For example –
- Unary/Recursive Relationship Set:
- Based on the degree of a relationship set, a relationship set can be classified into the following types-
- Degree of Relationship Sets:
-
-
-
-
-
- Binary Relationship Set
- A binary relationship set is a relationship set where two entity sets participate in a relationship set.
- It is also called Relationships of Degree 2.
- For example –
 Ternary Relationship Set
- A ternary relationship set is a relationship set where three entity sets participate in a relationship set.
- It is also called Relationships of Degree 3.
- For example –
- Binary Relationship Set
-
-
-
 Ternary Relationship Set

-
-
-
-
- N-ary Relationship Set
- An N-ary relationship set is a relationship set where ‘n’ entity sets participate in a relationship set.
- It is also called Relationships of Degree n.
- N-ary Relationship Set
-
-
-
- Cardinality/Structural Constraints:
-
- Cardinality specifies the number of instances of one entity that can be associated with instances of another entity.
- Cardinality is a constraint on a relationship specifying the number of entity instances that a specific entity may be related to via the relationship.
- Cardinality is often shown with lines connecting entities, annotated with symbols like 1, N, or M between the entity.
- Cardinality includes:
- One-to-One (1:1): A single instance of one entity is related to a single instance of another entity.
- One-to-Many (1:M/N or 1:*): A single instance of one entity is related to multiple instances of another entity.
- Many-to-Many (M: N or * : *): Multiple instances of one entity are related to multiple instances of another entity.
- Alternate Cardinality Representation are –

-
- Participation:
- Participation determines whether all or only some entity occurrences participate in a relationship.
- The minimum participation of an entity occurrence in the relationship is called Ordinality which is also closely linked to cardinality. While cardinality specifies the maximum occurrences/participation of an entity in a relationship.
- Participation:
- Aggregation:
- In DBMS, Aggregation is a concept used in the Entity-Relationship (E-R) model to express relationships between a relationship set and an entity set.
- It enables a higher level of abstraction by treating a relationship set as an entity set, thereby enhancing the clarity and organization of the database schema.
- It provides a higher-level abstraction that encapsulates a relationship set along with its associated entity sets to allow it to be treated as a single entity in another relationship.
- For example –
- Consider a scenario where a university database needs to represent the relationship between students, courses, and instructors. We have:
- Entities: Student, Course, Instructors
- Relationships:
- Enrolled: between Student and Course (with attributes like EnrollmentDate, Grade)
- Teaches: between Instructor and Course (with attributes like Semester, Year)
- Consider a scenario where a university database needs to represent the relationship between students, courses, and instructors. We have:
If we need to represent a situation where an instructor advises students based on the courses they teach, we can use aggregation. The aggregation encapsulates the relationship “Teaches” and treats it as a single entity when relating it to the “Advises” relationship.
-
- Benefits of Aggregation:
- Aggregation is a powerful concept in the E-R model of DBMS that helps in simplifying complex database relationships by encapsulating them into a single higher-level relationship.
- It provides a clear representation of how entities and relationships are interconnected, especially when multiple relationships are involved.
- Aggregation allows modular design of databases, making it easier to manage and update complex systems.
- Applications of Aggregation:
- Aggregation is particularly useful in large and complex databases such as university management systems, hospital management systems, and enterprise resource planning (ERP) systems.
- Aggregation provides a clear and structured representation of the hierarchical database relationships that exist among entities and their associations,
- Benefits of Aggregation:
Convention Styles of E-R Diagrams


Benefits of E-R Diagrams
- It provides a clear visual representation of the logical data model.
- It facilitates better communication among stakeholders by providing a common understanding of the database structure.
- It helps in designing a database by identifying entities, attributes, and relationships
Tools for Creating E-R Diagrams
- Draw.io
- Lucidchart
- Microsoft Visio
- MySQL Workbench
Use/Applications
- It is a useful tool for database designers, developers, and analysts in designing and modeling data systems.
- It is used to model the data requirements of a system or organization.
- E-R diagram helps in designing the schema of a database.
- It provides a high-level understanding of how data is structured and related i.e., system blueprint.
- It acts as a documentation tool for stakeholders to understand the database structure.
- They help in identifying the entities, their attributes, and the relationships among entities, ensuring that the data model is accurate and efficient.
- Briefly, we can say that it is widely used in database design and data modeling to illustrate how entities (such as tables) relate to each other within a database.
![]()
0 Comments